What's new  Creating exceptional customer experiences by 'doing it better'
Creating exceptional customer experiences by 'doing it better'
Optimise your customer experience by designing, deploying and managing digital solutions customised to your unique needs.
Continue reading
Delivering a positive customer experience has long been a goal of all businesses but in recent years it has become an industry of its own. Look no further than the fact we now talk about the concept in capital letters – Customer Experience – and have added CX to the list of acronyms sweeping the world. As we have previously outlined, the Customer Experience age has arrived and the likes of price and product are no longer the main brand differentiators for consumers.

Research has shown CX has overtaken both as the key to not only attracting but keeping business. Deliver a great Customer Experience and you are on the road to business success, as proven by data that shows consumers who enjoy a great customer experience are five times more likely to recommend a brand to other people and those who have a positive CX are 54% more likely to make another purchase.
It is one thing to believe your CX strategy is on the right track and another to know it. Enter Customer Experience metrics, with an ever-increasing number of options for measuring and showcasing how your people and products are performing and, in turn, identifying potential KPIs and areas for improvement. Given the plethora of CX metrics available, here is a snapshot of those that will best help you learn how your customers are interacting with your brand and guide the next phase of your CX strategy.
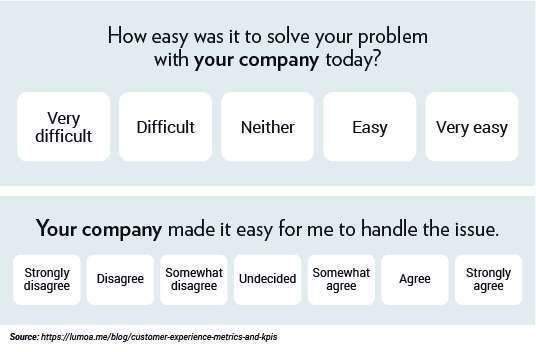
Customer Effort Score (CES)
A transactional metric, this powerful tool effectively measures how much effort your customers need to make to complete a task – or, in other words, how simply they can find something. This could range from getting a support request handled to identifying the product or service they were looking for.
The more effortless you make the Customer Experience, the more likely customers will buy from you again, as shown by a study by global research company Gartner that found 96% of customers who had high-effort experiences reported being disloyal compared to only 9% of customers with low-effort experiences.
So how do you measure CES? Typically by sending a post-interaction survey that asks customers to rate their experience from low to high and then calculating the average score and distribution of scores. You can then use this data to see where the CX is smooth, where there are friction points and how to make your services easier for customers to use.
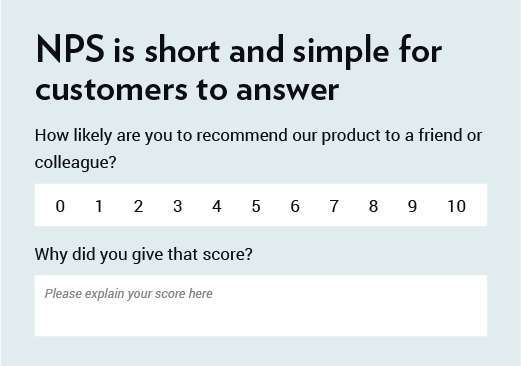
Net Promoter Score (NPS)
First developed by business strategist Fred Reichheld in 1993, NPS has established itself as one of the world’s most widely used market research measures with two-thirds of Fortune 1000 companies in 2020 using versions of the metric. Helping to predict customer purchase and referral behaviour, it typically takes the form of a single survey question, the most famous asking respondents to rate the likelihood they would recommend a company, product or service to a friend or colleague on a scale from 1-10.
Simple to calculate and highly effective, respondents can be split into three categories – detractors (answered 1-6), neutrals (7-8) and promoters (9-10). Subtracting the total number of detractors from your promoters will reveal your NPS, which can then be used to benchmark your performance against other companies that use the tool.
As NPS is broad in nature, it should not be used to measure product success. It is more focused on identifying how loyal customers are, their willingness to promote your brand and how such intentions change over time.
Customer Retention Rate
This metric measures how many customers stay with your business over a set period or keep handing over their money for your services. Crucially, retention can also show you when they are likely to stop using your service, be it after a week, month or quarter. Needless to say, strong CX can entice customers to keep coming back and thus lower overall costs and increase loyalty rates.
There are a few ways to calculate Customer Retention Rate including subtracting the number of customers who churn over a period from those who remain loyal (ie: 80% retention minus 20% churn equals 60% retention rate). Another is to compare how many customers stay loyal between two similar periods (eg: 2020 vs 2021).
Studying retention is an ideal way to get a better handle of CX by tracking certain moments in a product or service’s life cycle, in turn allowing you to consider improvements or enhancements that give customers a reason to continue using it. The importance of this cannot be understated as it is certainly more expensive to attract and onboard new customers than it is to keep current ones.
Customer Churn Rate
This is essentially the opposite of Customer Retention Rate and calculated by dividing the number of customers lost during a set timeframe by the number you had at the beginning of the period. It is based on the premise that people won’t walk away from a business if they are having a positive experience and, as highlighted above, it costs more to find new customers than keep existing ones.
Businesses love a low churn rate because it means they have more loyal customers. By monitoring Customer Churn Rate, it is possible to pinpoint moments where customers started falling away and aim to identify the reasons the drop-off occurred. Diving deeper into customer demographics (eg: age groups) can also lead to product adjustments targeted at specific groups of users. It is also about having the visibility one needs to make adjustments to improve the customer experience before it’s too late.
Customer Satisfaction (CSAT)
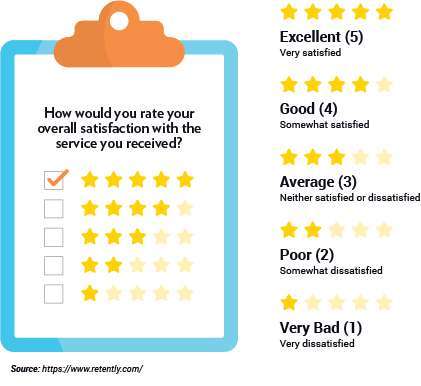
As the name suggests, CSAT measures the average satisfaction of customers. Knowing how happy – or unhappy – customers are with your business or services is crucial in meeting today’s expectations and planning for tomorrow. CSAT surveys are often given within a few hours of a transaction or event and asked customers to rate their satisfaction on a scale from Very Satisfied to Not Satisfied at All.
CSAT is typically used to measure satisfaction related to specific interactions such as making a booking, returning a product or phoning a call centre. The targeted nature allows you to use CSAT responses to learn what parts of a product or process leave customers satisfied or unsatisfied, with adjustments then able to be rolled out to tackle specific issues or concerns.
Average Resolution Time (ART)
Nothing negatively impacts CX quite like wasting a customer’s precious, hence the importance of this metric. ART identifies how long it takes on average to solve a customer issue and identify the efficiency of both the organisation and specific support teams. It is a particularly powerful metric for call centres or support desks and can have a direct impact on your company’s CSAT score.
The calculation is simple – take the total time it takes to resolve all issues over a set period and divide it by the number of calls or interactions. One of the great strengths of measuring ART is the ability to notice sudden spikes in resolution time and consider the reasons that may be occurring. If multiple customers are spending additional time on the phone line or help desk, it may well be a sign of the complexity of a product or service rather than unnecessary engagement by staff members.
Summary
The above is just a sample of the many Customer Experience metrics that companies can invest their time and money in.The key now is to identify those that work best for your personal situation. Decreasing churn rates and increasing CSAT may be the ultimate goal but it starts with knowing what your customers are thinking. Better still, the more you know, the more positive you can make their experiences.
Learn more about how one company improved internal processes and significantly improved customer satisfaction in this Case Study.
Related Articles

Technology
RPA in finance and accounting - a digital transformation
The finance and accounting sector is burdened by repetitive and time-consuming tasks, which is why robotic process automation is ideal...

Technology
How to get started with intelligent automation
RPA can create growth opportunities and reduce operational costs but it is not a 'one size fits all' concept. Learn more in this blog here.

Technology
8 RPA trends to watch
From hyperautomation to low-code platforms and increased focus on security, learn about the latest developments shaping the world of automation.